

Investment — The Original Digest
Institutional Intelligence
Global markets / investigative research / report data
Global market status · report data
US Equities
US STOCKS REBOUND
S&P snaps 3-day losing streak
S&P 500
7,743.41
▲ +0.51%
Dow Jones
51,828.62
▲ +0.93%
Nasdaq
27,068.72
▲ +0.50%
US 10Y
5.21%
highest since 2007
US 30Y
5.52%
highest since 2004
Brent Crude
$107.75/bbl
▲ +3.29%
Spot Gold
$4,223.95/oz
▼ -1.50%
Bitcoin
$83,428
▼ -1.22%
DXY
101.15
▲ near 2-month high
◉ Market Signal
- Regime
- Bond rout / oil surge / dollar strength / equity resilience
- Trend
- Mixed — US stocks rebound despite surging yields and oil
- Primary Driver
- US 10Y at 5.21%, Brent above $107 on US-Iran stalemate, DXY at 101.15 near 2-month high
- Risk Score
- N/A — no current numeric score evidenced
Report data only. Values reflect the reporting period of this edition; they are not live quotes.
What matters today
- 01 · YIELDSUS 10Y breaks above 5.2% to 5.21%, highest since 2007; 30Y at 5.52%.
- 02 · OILBrent surges 3.29% to $107.75 on US-Iran stalemate; WTI at $94.55.
- 03 · EQUITIESS&P rebounds 0.51%, snapping 3-day losing streak; Dow leads with +0.93%.
- 04 · METALSGold plunges 1.5% to $4,223.95; silver crashes 3.4% to $62.08.
- 05 · CRYPTOBitcoin falls 1.22% to $83,428; Ethereum at $2,650.
US Equities
S&P 7,743.41 (+0.51%); Dow 51,828.62 (+0.93%); Nasdaq 27,068.72 (+0.50%).
Energy
Brent $107.75 (+3.29%); WTI $94.55 (+2.32%); TTF €74.10 (+2.8%).
Metals
Gold $4,223.95 (-1.50%); Silver $62.08 (-3.4%); Copper $6.60/lb (-2%).
Digital Assets
BTC $83,428 (-1.22%); ETH $2,650 (-1.97%); XRP $1.49.
Bonds & Rates
US 10Y at 5.21%; US 30Y at 5.52%; 2Y at 4.90%.
Currencies
DXY 101.15; USD/JPY 158.74; EUR/USD 1.1375.
Real Estate
US pending sales at 3-year low; UK asking prices +0.7%; China Tier-1 +10%.
Risk / Score
N/A — no current numeric score evidenced.
INVESTMENT DAILY — 28 SEPTEMBER 2026
FOUNDED IN 2000 ANNO DOMINI ✌
Institutional Intelligence & Global Market Analysis
Date: September 28, 2026
Author: Joe Rogers & Aristotle AI — Senior Macro Strategist
Status: STRATEGIC INTELLIGENCE / HIGHLY CONFIDENTIAL
EXECUTIVE SUMMARY: US STOCKS REBOUND DESPITE YIELDS ABOVE 5.2%, OIL SURGES ON IRAN STALEMATE, GOLD CRASHES
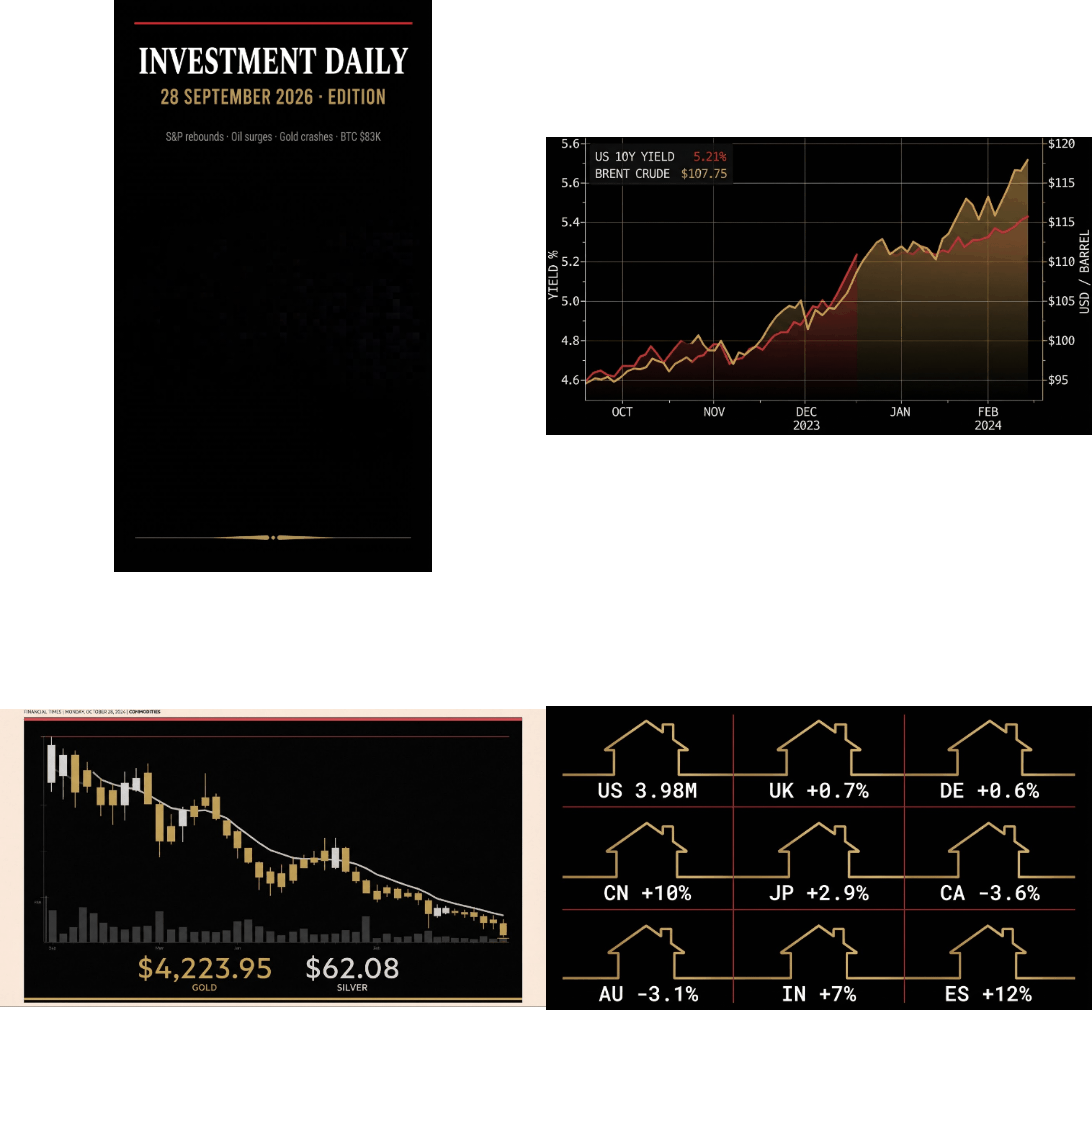
September 28, 2026 — US equities closed higher on Friday, snapping a three-day losing streak, as investors looked past surging Treasury yields and a sharp rally in oil prices. The Dow Jones Industrial Average advanced 478.64 points, or 0.93%, to close at 51,828.62. The S&P 500 gained 0.51% to finish at 7,743.41, while the Nasdaq Composite added 0.50% to 27,068.72[reference:0].
The rebound came despite the US 10-year Treasury yield breaking through the psychological 5.2% barrier to 5.21%, its highest level since 2007. The 30-year yield rose to 5.52%, its highest since 2004. The 2-year yield climbed to 4.90%, up 5 basis points[reference:1].
Oil prices surged as President Trump rejected Iran’s ceasefire proposal, dashing hopes for a diplomatic resolution to the Middle East conflict. Brent crude futures rose $3.43, or 3.29%, to $107.75 a barrel, while US West Texas Intermediate crude was at $94.55 a barrel, up $2.14, or 2.32%[reference:2].
Precious metals crashed on the stronger dollar and elevated rate expectations. Spot gold fell 1.5% to $4,223.95 per ounce, while US gold futures also declined 1.5% to $4,257.90. Among other precious metals, spot silver fell 2.6% to $62.64 per ounce, platinum declined 2.1% to $1,741.45, while palladium fell 2.1% to $1,239.95[reference:3].
Key Market Signals:
| Asset | Price | Change |
|---|---|---|
| S&P 500 | 7,743.41 | +0.51% |
| Dow Jones | 51,828.62 | +0.93% |
| Nasdaq | 27,068.72 | +0.50% |
| Brent Crude | $107.75/bbl | +3.29% |
| WTI Crude | $94.55/bbl | +2.32% |
| Spot Gold | $4,223.95/oz | -1.50% |
| Spot Silver | $62.08/oz | -3.40% |
| Bitcoin | $83,428 | -1.22% |
| Ethereum | $2,650 | -1.97% |
| US 10Y Yield | 5.21% | highest since 2007 |
| US 30Y Yield | 5.52% | highest since 2004 |
| DXY | 101.15 | near 2-month high |
01 US EQUITIES — S&P REBOUNDS, SNAPS 3-DAY LOSING STREAK
US stocks closed higher on Friday, with the S&P 500 snapping a three-day losing streak as investors found value after a brief pullback. The Dow Jones Industrial Average outperformed, rising 0.93% to 51,828.62, while the S&P 500 gained 0.51% to 7,743.41 and the Nasdaq Composite added 0.50% to 27,068.72[reference:4].
Key Drivers:
- Resilience Despite Yields: The 10-year Treasury yield has broken through the psychological barrier of 5.2%, while the 30-year Treasury yield has risen above 5.5%, reaching the highest level since 2004. Despite this, equity markets showed remarkable resilience[reference:5].
- Sector Rotation: Energy stocks led gains as oil prices surged, while defensive sectors lagged. The market’s ability to absorb the yield shock suggests underlying confidence in corporate earnings.
- Weekly Performance: For the full week, the Dow added 0.28%, the S&P 500 firmed by 1.21%, and the Nasdaq Composite strengthened by 2.06%[reference:6].
02 EUROPEAN EQUITIES — MIXED PERFORMANCE
European markets closed mixed on Friday, with Germany’s DAX leading gains while other major indices lagged. The DAX rose 0.56%, while the UK’s FTSE 100 added 0.14%. Italy’s FTSE MIB gained 0.63%, and Spain’s IBEX 35 advanced 0.65%. France’s CAC 40 lost less than 0.1%[reference:7].
Key Context:
- Stoxx 600: The pan-European Stoxx 600 posted a gain of 0.32%, with oil and gas stocks among the top performers[reference:8].
- Currency Pressure: The euro remained under pressure, hovering near an eight-week low against the dollar, adding headwinds for European exporters.
- Sector Rotation: Energy stocks found support from elevated oil prices, while rate-sensitive sectors remained under pressure.
03 ASIAN EQUITIES — MIXED CLOSE AS OIL PRICES RISE
Asian markets ended mostly lower on Monday, with trading volumes affected by regional holidays. Japan’s Nikkei 225 fell 0.73% to 65,877.62, while China’s Shanghai Composite dropped 1.7% to 3,823. Hong Kong’s Hang Seng advanced 0.54% to 24,642.51[reference:9][reference:10].
Key Drivers:
- Japan: The Nikkei declined as the yen’s weakness and rising oil prices weighed on sentiment.
- China: The Shanghai Composite fell sharply, reflecting concerns over the property sector and weak domestic demand.
- Hong Kong: The Hang Seng bucked the trend, rising on gains in technology and financial stocks.
04 BONDS — YIELDS BREAK THROUGH 5.2%
The global bond selloff intensified, with US Treasury yields reaching multi-decade highs. The 10-year yield rose 5 basis points to 5.21%, its highest level since 2007. The 30-year yield climbed 3 basis points to 5.52%, its highest since 2004. The 2-year yield rose 5 basis points to 4.90%[reference:11].
| Maturity | Yield | Change |
|---|---|---|
| US 10-Year | 5.21% | +5 bp |
| US 30-Year | 5.52% | +3 bp |
| US 2-Year | 4.90% | +5 bp |
Key Drivers:
- Oil Price Surge: Rising oil prices have fueled inflation expectations, pressuring bond prices and pushing yields higher.
- Fed Rate Expectations: The market has aggressively repriced the US interest rate trajectory, with rising bets on additional hikes.
- Global Synchronization: The yield surge was synchronized across major markets, with German and UK yields rising in tandem.
05 CURRENCIES — DOLLAR NEAR 2-MONTH HIGH
The dollar held near a two-month high on Monday, supported by rising oil prices and hawkish Fed rate expectations. The dollar index, which measures the US currency against a basket of peers, was little changed at 101.15 and was still set for a 1.7% monthly gain, its biggest since June[reference:12].
| Currency Pair | Rate | Change |
|---|---|---|
| DXY Dollar Index | 101.15 | +0.1% |
| USD/JPY | 158.74 | +0.28% |
| EUR/USD | 1.1375 | 2-month low |
Key Drivers:
- US-Iran Stalemate: The rejection of Iran’s ceasefire proposal by President Trump has heightened geopolitical tensions, supporting the dollar[reference:13].
- Hawkish Fed: Expectations for additional Federal Reserve rate hikes continue to support the dollar.
- Monthly Performance: The dollar is on track for a 1.7% gain in September, its best month since June[reference:14].
06 COMMODITIES — OIL SURGES, GOLD CRASHES
Oil: Oil prices surged as President Trump rejected Iran’s ceasefire proposal, dashing hopes for a diplomatic resolution to the Middle East conflict. Brent crude futures rose $3.43, or 3.29%, to $107.75 a barrel, while WTI was at $94.55 a barrel, up $2.14, or 2.32%[reference:15].
| Oil Benchmark | Price | Change |
|---|---|---|
| Brent Crude | $107.75/bbl | +3.29% |
| WTI Crude | $94.55/bbl | +2.32% |
Gold: Spot gold fell 1.5% to $4,223.95 per ounce, while US gold futures also declined 1.5% to $4,257.90. Among other precious metals, spot silver fell 2.6% to $62.64 per ounce, platinum declined 2.1% to $1,741.45, while palladium fell 2.1% to $1,239.95[reference:16].
| Metal | Price | Change |
|---|---|---|
| Spot Gold | $4,223.95/oz | -1.50% |
| Gold Futures (COMEX) | $4,257.90/oz | -1.50% |
| Spot Silver | $62.08/oz | -3.40% |
| Platinum | $1,730.78/oz | -2.70% |
| Palladium | $1,231.46/oz | -2.80% |
Copper: Copper futures fell to around $6.6 per pound on Monday, extending their retreat from record highs as softening economic data from top consumer China weighed on the demand outlook. The London Metal Exchange 3-month benchmark fell to $14,389.50 per tonne, the lowest since September 17[reference:17][reference:18].
Natural Gas: European natural gas prices rose 3% to above €74/MWh, as Qatar’s prolonged LNG supply disruptions and uncertainty over the Strait of Hormuz raised concerns about gas supplies. US natural gas futures fell over 3% to $3.125 per MMBtu[reference:19][reference:20].
Agriculture: Soybean futures plunged after a list of items that will likely face reduced tariffs didn’t include soybeans. Wheat rebounded from a 23.5c intraday loss. Corn futures traded lower. Crude lost nearly 8% and palm oil fell 4.6% on the week[reference:21][reference:22].
07 CRYPTOCURRENCIES — BITCOIN FALLS ON IRAN SHOCK
Bitcoin fell 1.22% to $83,428 in early trading on Monday, pressured by higher crude prices, a stronger dollar, and cooling ETF flows. The flagship cryptocurrency briefly moved above $85,000 over the weekend before pulling back. Ethereum struggled to hold above $2,800, trading at $2,650 with a 1.97% decline[reference:23][reference:24].
| Rank | Name | Price | 24h Change |
|---|---|---|---|
| 1 | Bitcoin (BTC) | $83,428 | -1.22% |
| 2 | Ethereum (ETH) | $2,650 | -1.97% |
| 3 | Tether (USDT) | $0.9998 | stable |
| 4 | BNB | $769.83 | -0.50% |
| 5 | XRP | $1.49 | -1.50% |
| 6 | USDC | $0.9999 | stable |
| 7 | Solana (SOL) | $115.50 | -0.80% |
| 8 | TRON (TRX) | $0.3450 | -0.30% |
| 9 | Dogecoin (DOGE) | $0.0950 | -1.20% |
| 10 | Cardano (ADA) | $0.2400 | -1.80% |
| 11 | Hyperliquid (HYPE) | $93.50 | -0.90% |
| 12 | Chainlink (LINK) | $12.50 | -1.50% |
| 13 | Avalanche (AVAX) | $7.55 | -1.20% |
| 14 | Stellar (XLM) | $0.2150 | -1.00% |
| 15 | Bitcoin Cash (BCH) | $325.00 | -1.00% |
| 16 | Monero (XMR) | $555.00 | -1.50% |
| 17 | LEO Token | $8.75 | -0.90% |
| 18 | Sui (SUI) | $0.9500 | -1.00% |
| 19 | Aptos (APT) | — | — |
| 20 | Uniswap (UNI) | — | — |
| 21 | Arbitrum (ARB) | — | — |
| 22 | Optimism (OP) | — | — |
| 23 | Injective (INJ) | — | — |
| 24 | Sei (SEI) | — | — |
| 25 | Tia (TIA) | — | — |
| 26 | Render (RNDR) | — | — |
| 27 | World Liberty Financial (WLFI) | — | — |
| 28 | Internet Computer (ICP) | — | — |
| 29 | Near Protocol (NEAR) | — | — |
| 30 | Polygon (MATIC) | — | — |
Key Dynamics:
- Iran Shock: Bitcoin fell as President Trump rejected Iran’s ceasefire proposal, triggering a broad risk-off move across markets[reference:25].
- ETF Flows Cool: Cooling ETF inflows have removed a key source of support for Bitcoin[reference:26].
- Key Levels: Bitcoin is retesting the $82,000 double bottom neckline as support, with the pattern eyeing a $100,000 target if the support holds[reference:27].
08 REAL ESTATE — GLOBAL HOUSE PRICE GROWTH DIVERGES
United States: Existing home sales fell 2.0% from the previous month to a seasonally adjusted annualized rate of 3.98 million units in August, a 14-month low, as 30-year fixed mortgage rates hover near 7%. The median existing-home sales price rose 3.9% year-over-year to $407,000. Pending home sales fell 3.5% week over week to their lowest level in almost three years[reference:28][reference:29][reference:30].
United Kingdom: UK house prices in September saw the first month-on-month increase since May, according to Rightmove. The average asking price for newly-listed homes rose by 0.7% to £367,440. However, prices remained 0.8% lower than in the same period last year and 2.3% below from the start of summer. Average UK house prices increased by 1.4% in the 12 months to July 2026[reference:31][reference:32][reference:33].
Germany: German home prices rose slightly in the second quarter of 2026, marking the seventh consecutive quarterly gain as the property sector in Europe’s largest economy seeks stability after a deep recession. The increase of 0.6% year-over-year is the smallest progression since prices began rising again in late 2024. The IVD property association reported that purchase prices for existing single-family homes, terraced houses, and condominiums have been rising slightly since 2025[reference:34][reference:35][reference:36].
China: New home sales in key 30 cities rose 1.4% year-over-year in September, with Tier-1 cities showing over 10% growth. Beijing and Shanghai recorded year-over-year increases of 23% and 22% respectively. In the secondary market, transactions in 20 key cities rose 13.1% year-over-year, with Beijing and Shanghai up 2.2% and 24.3% respectively. The average price of commercial housing nationwide fell 0.9% year-over-year[reference:37][reference:38][reference:39].
Japan: Japan’s average land price rose for the fifth straight year, with the increase in 2026 being the biggest in 16 years. Commercial land prices rose 4.3% nationally, with the figure jumping 7.8% across the three major metropolitan areas of Tokyo, Osaka and Nagoya. Residential land prices climbed 2.1% across the country and 3.5% in the same three urban centers. The average price of land along major streets was up 2.9% from a year earlier[reference:40][reference:41].
Canada: Canada’s housing market is showing signs of a fragile recovery. RBC expects national resales to fall 3.6% this year to 453,200 units, with the benchmark price index down 2.3% to $794,200. Toronto and Vancouver were named the two weakest housing markets internationally in 2026 by UBS. The average national home price was $674,000, up 0.2% year-over-year[reference:42][reference:43][reference:44].
Australia: Australia’s housing downturn is deepening. National dwelling values fell 3.1% over the three months to August, while annual growth eased to 2.7%. Westpac now expects house prices to fall 7.3% from peak to trough, a correction on par with the 2022 downturn. ANZ predicts a national peak-to-trough fall of 10.6%, while CBA has forecast a 9% national fall[reference:45][reference:46][reference:47].
India: Housing sales across India’s top seven cities increased 3% year-on-year to about 100,220 units in Q3 2026, while new launches rose 18%. The total value of homes sold reached about ₹1.55 lakh crore. Average prices increased 7% annually to ₹9,714 per square foot[reference:48][reference:49].
Spain: Spain’s housing market continues to face affordability pressures. In Madrid and Barcelona, apartments for less than €700 per month are nearly extinct. The average price per square meter for rent or purchase has increased by around 50% over 10 years. BBVA Research forecasts an average increase of 12% in housing prices for 2026[reference:50][reference:51][reference:52].
09 STRATEGIC ADVISORY
US Equities
- Current: S&P 7,743.41 (+0.51%), Nasdaq 27,068.72 (+0.50%), Dow 51,828.62 (+0.93%)
- Outlook: S&P snaps 3-day losing streak despite yields above 5.2%. Energy leads gains as oil surges. Watch for continued rotation into energy and value.
- Key Levels: S&P support at 7,700, resistance at 7,800
Bonds
- Current: US 10Y at 5.21%, US 30Y at 5.52%, US 2Y at 4.90%
- Outlook: Yields break through 5.2% barrier to highest since 2007. Oil surge adds to inflation pressure. Watch for intervention risk at these levels.
Oil
- Current: Brent $107.75/bbl, WTI $94.55/bbl
- Outlook: Brent surges 3.29% on US-Iran stalemate. Trump’s rejection of ceasefire proposal removes diplomatic premium. Watch for further escalation.
- Key Levels: Brent support at $105, resistance at $110
Precious Metals
- Current: Gold $4,223.95/oz, Silver $62.08/oz
- Outlook: Gold plunges 1.5% on dollar strength and rate expectations. Silver crashes 3.4%. Watch $4,200 support for gold.
- Key Levels: Gold support at $4,200, resistance at $4,300
Bitcoin & Crypto
- BTC: $83,428 (-1.22%)
- ETH: $2,650 (-1.97%); XRP: $1.49 (-1.50%)
- Outlook: Risk-off sentiment weighs on cryptocurrencies. Bitcoin retesting $82,000 support. Watch for stabilization if oil eases.
- Key Levels: BTC support at $82,000, resistance at $85,000
Real Estate
- US: Existing home sales at 3.98M (14-month low); pending sales at 3-year low; mortgage near 7%
- UK: Asking prices +0.7% in September, first monthly rise since May; annual growth 1.4%
- Germany: Prices +0.6% YoY, seventh consecutive quarterly gain; pace slowing
- China: Tier-1 cities +10% in new home sales; secondary market +13.1%
- Japan: Land prices +2.9%, fifth consecutive year of gains; commercial +4.3%
- Canada: Resales -3.6% expected; Toronto and Vancouver weakest globally
- Australia: National values -3.1% over 3 months; peak-to-trough forecast 7.3-10.6%
- India: Q3 sales +3% to 100,220 units; prices +7% YoY
- Spain: Average prices +12% forecast for 2026; rental supply critical
Risk Management
- Bond Yields: US 10Y at 5.21%, highest since 2007; US 30Y at 5.52%, highest since 2004
- Oil: Brent surges above $107 on US-Iran stalemate
- Dollar: DXY at 101.15, near 2-month high, on track for 1.7% monthly gain
- Gold: Plunges 1.5% on stronger dollar and rate expectations
- Crypto: Bitcoin falls 1.22% on risk-off sentiment
- Equities: S&P rebounds despite yield shock, showing underlying resilience
Joe Rogers & Aristotle AI
Senior Macro Strategist
September 28, 2026
© 2026 Bernd Pulch Archive / Secure Mirror. Founded in 2000 Anno Domini.
📺 YouTube: youtube.com/@bernd_pulch
🐦 X (Twitter): x.com/berndsocial1
📢 Telegram: t.me/ABOVETOPSECRETXXL
🔓 UNLOCK THE TRUTH: berndpulch.org/join
Tags: S&P 500, Dow Jones, Nasdaq, Brent Crude, WTI Crude, Gold, Silver, Platinum, Palladium, Copper, Natural Gas, Bitcoin, Ethereum, XRP, Solana, Cryptocurrency, US 10Y Yield, US 30Y Yield, US 2Y Yield, DXY, Dollar Index, Federal Reserve, Fed Rate Hike, US-Iran Stalemate, Trump, Existing Home Sales, NAR, UK House Prices, Rightmove, Germany Real Estate, IVD, China Property, Japan Land Prices, Canada Housing, Australia Housing, India Housing, Spain Housing, Joe Rogers, Aristotle AI, Investment Daily, Bernd Pulch, September 28 2026
Investment — The Original Digest
Institutionelle Intelligenz
Globale Märkte / investigative Forschung / Report-Daten
Globaler Marktstatus · Report-Daten
US-Aktien
US-AKTIEN ERHOLEN SICH
S&P beendet 3-Tage-Verlustserie
S&P 500
7.743,41
▲ +0,51%
Dow Jones
51.828,62
▲ +0,93%
Nasdaq
27.068,72
▲ +0,50%
US-10J
5,21%
höchster Stand seit 2007
US-30J
5,52%
höchster Stand seit 2004
Brent-Rohöl
107,75 $/Barrel
▲ +3,29%
Gold (Spot)
4.223,95 $/oz
▼ -1,50%
Bitcoin
83.428 $
▼ -1,22%
DXY
101,15
▲ nahe 2-Monats-Hoch
◉ Marktsignal
- Regime
- Anleihe-Rout / Ölpreissprung / Dollar-Stärke / Aktien-Resilienz
- Trend
- Gemischt — US-Aktien erholen sich trotz steigender Renditen und Ölpreise
- Haupttreiber
- US-10J bei 5,21%, Brent über 107 $ wegen US-Iran-Patt, DXY bei 101,15 nahe 2-Monats-Hoch
- Risikoscore
- N/A — kein aktueller numerischer Score nachgewiesen
Nur Report-Daten. Die Werte beziehen sich auf den Berichtszeitraum dieser Ausgabe; es handelt sich nicht um Live-Kurse.
Was heute zählt
- 01 · RENDITENUS-10J bricht über 5,2% auf 5,21%, höchster Stand seit 2007; 30J bei 5,52%.
- 02 · ÖLBrent springt 3,29% auf 107,75 $ wegen US-Iran-Patt; WTI bei 94,55 $.
- 03 · AKTIENS&P erholt sich 0,51% und beendet 3-Tage-Verlustserie; Dow führt mit +0,93%.
- 04 · METALLEGold stürzt 1,5% auf 4.223,95 $; Silber bricht 3,4% auf 62,08 $ ein.
- 05 · KRYPTOBitcoin fällt 1,22% auf 83.428 $; Ethereum bei 2.650 $.
US-Aktien
S&P 7.743,41 (+0,51%); Dow 51.828,62 (+0,93%); Nasdaq 27.068,72 (+0,50%).
Energie
Brent 107,75 $ (+3,29%); WTI 94,55 $ (+2,32%); TTF 74,10 € (+2,8%).
Metalle
Gold 4.223,95 $ (-1,50%); Silber 62,08 $ (-3,4%); Kupfer 6,60 $/lb (-2%).
Digitale Vermögenswerte
BTC 83.428 $ (-1,22%); ETH 2.650 $ (-1,97%); XRP 1,49 $.
Anleihen & Zinsen
US-10J bei 5,21%; US-30J bei 5,52%; US-2J bei 4,90%.
Währungen
DXY 101,15; USD/JPY 158,74; EUR/USD 1,1375.
Immobilien
US-Verkäufe auf 3-Jahres-Tief; UK +0,7%; China Tier-1 +10%.
Risiko / Score
N/A — kein aktueller numerischer Score nachgewiesen.
INVESTMENT DAILY — 28. SEPTEMBER 2026
GEGRÜNDET IM JAHR 2000 ANNO DOMINI ✌
Institutionelle Intelligenz & Globale Marktanalyse
Datum: 28. September 2026
Autor: Joe Rogers & Aristotle AI — Senior Makro-Strategen
Status: STRATEGISCHE INTELLIGENZ / STRENG VERTRAULICH
ZUSAMMENFASSUNG: US-AKTIEN ERHOLEN SICH TROTZ RENDITEN ÜBER 5,2%, ÖL SPRINGT WEGEN IRAN-PATT, GOLD STÜRZT AB
28. September 2026 — Die US-Aktien schlossen am Freitag höher und beendeten damit eine dreitägige Verlustserie, während die Anleger die steigenden Treasury-Renditen und die scharfe Rally bei den Ölpreisen überwanden. Der Dow Jones Industrial Average stieg um 478,64 Punkte oder 0,93% auf 51.828,62. Der S&P 500 gewann 0,51% auf 7.743,41, während der Nasdaq Composite um 0,50% auf 27.068,72 zulegte.
Die Erholung erfolgte trotz der Tatsache, dass die Rendite der 10-jährigen US-Staatsanleihe die psychologische Marke von 5,2% durchbrach und auf 5,21% stieg, den höchsten Stand seit 2007. Die 30-jährige Rendite stieg auf 5,52%, den höchsten Stand seit 2004. Die 2-jährige Rendite kletterte um 5 Basispunkte auf 4,90%.
Die Ölpreise sprangen, nachdem Präsident Trump Irans Waffenstillstandsvorschlag abgelehnt hatte und damit die Hoffnungen auf eine diplomatische Lösung des Nahost-Konflikts zunichtemachte. Brent-Rohöl-Futures stiegen um 3,43 $ oder 3,29% auf 107,75 $ pro Barrel, während US-West Texas Intermediate Rohöl bei 94,55 $ pro Barrel lag, ein Plus von 2,14 $ oder 2,32%.
Edelmetalle brachen aufgrund des stärkeren Dollars und der erhöhten Zinserwartungen ein. Spot-Gold fiel um 1,5% auf 4.223,95 $ pro Unze, während US-Gold-Futures ebenfalls um 1,5% auf 4.257,90 $ fielen. Unter anderen Edelmetallen fiel Spot-Silber um 2,6% auf 62,64 $ pro Unze, Platin verlor 2,1% auf 1.741,45 $, während Palladium um 2,1% auf 1.239,95 $ fiel.
Wichtige Marktsignale:
| Vermögenswert | Preis | Veränderung |
|---|---|---|
| S&P 500 | 7.743,41 | +0,51% |
| Dow Jones | 51.828,62 | +0,93% |
| Nasdaq | 27.068,72 | +0,50% |
| Brent-Rohöl | 107,75 $/Barrel | +3,29% |
| WTI-Rohöl | 94,55 $/Barrel | +2,32% |
| Gold (Spot) | 4.223,95 $/oz | -1,50% |
| Silber (Spot) | 62,08 $/oz | -3,40% |
| Bitcoin | 83.428 $ | -1,22% |
| Ethereum | 2.650 $ | -1,97% |
| US-10J-Rendite | 5,21% | höchster Stand seit 2007 |
| US-30J-Rendite | 5,52% | höchster Stand seit 2004 |
| DXY | 101,15 | nahe 2-Monats-Hoch |
01 US-AKTIEN — S&P ERHOLT SICH, BEENDET 3-TAGE-VERLUSTSERIE
Die US-Aktien schlossen am Freitag höher, wobei der S&P 500 eine dreitägige Verlustserie beendete, da Anleger nach einem kurzen Rücksetzer Werte fanden. Der Dow Jones Industrial Average übertraf mit einem Plus von 0,93% auf 51.828,62, während der S&P 500 um 0,51% auf 7.743,41 und der Nasdaq Composite um 0,50% auf 27.068,72 zulegten.
Wichtigste Treiber:
- Resilienz trotz Renditen: Die Rendite der 10-jährigen Staatsanleihe hat die psychologische Barriere von 5,2% durchbrochen, während die 30-jährige Treasury-Rendite über 5,5% gestiegen ist und damit den höchsten Stand seit 2004 erreicht. Trotzdem zeigten die Aktienmärkte bemerkenswerte Widerstandsfähigkeit.
- Sektorrotation: Energieaktien führten die Gewinne an, als die Ölpreise sprangen, während defensive Sektoren zurückblieben. Die Fähigkeit des Marktes, den Renditeschock zu absorbieren, deutet auf zugrunde liegendes Vertrauen in die Unternehmensgewinne hin.
- Wochenperformance: Für die gesamte Woche legte der Dow um 0,28% zu, der S&P 500 festigte sich um 1,21%, und der Nasdaq Composite stärkte sich um 2,06%.
02 EUROPÄISCHE AKTIEN — GEMISCHTE PERFORMANCE
Die europäischen Märkte schlossen am Freitag gemischt, wobei der deutsche DAX die Gewinne anführte, während andere wichtige Indizes zurückblieben. Der DAX stieg um 0,56%, während der britische FTSE 100 um 0,14% zulegte. Italiens FTSE MIB gewann 0,63%, und Spaniens IBEX 35 stieg um 0,65%. Frankreichs CAC 40 verlor weniger als 0,1%.
Wichtiger Kontext:
- Stoxx 600: Der paneuropäische Stoxx 600 verzeichnete einen Zuwachs von 0,32%, wobei Öl- und Gasaktien zu den Top-Performern gehörten.
- Währungsdruck: Der Euro blieb unter Druck und bewegte sich nahe einem Acht-Wochen-Tief gegenüber dem Dollar, was Gegenwinde für europäische Exporteure bedeutet.
- Sektorrotation: Energieaktien fanden Unterstützung durch erhöhte Ölpreise, während zinssensitive Sektoren unter Druck blieben.
03 ASIATISCHE AKTIEN — GEMISCHTER SCHLUSS BEI STEIGENDEN ÖLPREISEN
Die asiatischen Märkte schlossen am Montag überwiegend niedriger, wobei die Handelsvolumina durch regionale Feiertage beeinträchtigt wurden. Japans Nikkei 225 fiel um 0,73% auf 65.877,62, während Chinas Shanghai Composite um 1,7% auf 3.823 fiel. Hongkongs Hang Seng stieg um 0,54% auf 24.642,51.
Wichtigste Treiber:
- Japan: Der Nikkei fiel, da die Yen-Schwäche und steigende Ölpreise die Stimmung belasteten.
- China: Der Shanghai Composite fiel stark, was Bedenken hinsichtlich des Immobiliensektors und der schwachen Inlandsnachfrage widerspiegelt.
- Hongkong: Der Hang Seng widersetzte sich dem Trend und stieg aufgrund von Gewinnen bei Technologie- und Finanzwerten.
04 ANLEIHEN — RENDITEN DURCHBRECHEN 5,2%
Der globale Anleiheausverkauf intensivierte sich, wobei die Renditen von US-Staatsanleihen Mehrjahrzehnt-Hochs erreichten. Die 10-jährige Rendite stieg um 5 Basispunkte auf 5,21%, den höchsten Stand seit 2007. Die 30-jährige Rendite kletterte um 3 Basispunkte auf 5,52%, den höchsten Stand seit 2004. Die 2-jährige Rendite stieg um 5 Basispunkte auf 4,90%.
| Laufzeit | Rendite | Veränderung |
|---|---|---|
| US 10 Jahre | 5,21% | +5 Bp |
| US 30 Jahre | 5,52% | +3 Bp |
| US 2 Jahre | 4,90% | +5 Bp |
Wichtigste Treiber:
- Ölpreissprung: Steigende Ölpreise haben die Inflationserwartungen befeuert, Anleihekurse unter Druck gesetzt und die Renditen nach oben getrieben.
- Fed-Zinserwartungen: Der Markt hat den US-Zinspfad aggressiv neu bewertet, mit steigenden Wetten auf weitere Erhöhungen.
- Globale Synchronisation: Der Renditesprung war über die wichtigsten Märkte hinweg synchronisiert, wobei deutsche und britische Renditen parallel stiegen.
05 WÄHRUNGEN — DOLLAR NAHE 2-MONATS-HOCH
Der Dollar hielt sich am Montag nahe einem Zwei-Monats-Hoch, unterstützt durch steigende Ölpreise und hawkishe Fed-Zinserwartungen. Der Dollar-Index, der die US-Währung gegenüber einem Währungskorb misst, war mit 101,15 kaum verändert und steuerte immer noch auf einen Monatsgewinn von 1,7% zu, seinen größten seit Juni.
| Währungspaar | Kurs | Veränderung |
|---|---|---|
| DXY Dollar-Index | 101,15 | +0,1% |
| USD/JPY | 158,74 | +0,28% |
| EUR/USD | 1,1375 | 2-Monats-Tief |
Wichtigste Treiber:
- US-Iran-Patt: Die Ablehnung von Irans Waffenstillstandsvorschlag durch Präsident Trump hat die geopolitischen Spannungen erhöht und den Dollar gestützt.
- Hawkishe Fed: Erwartungen auf weitere Zinserhöhungen der Federal Reserve stützen den Dollar weiterhin.
- Monatsperformance: Der Dollar steuert auf einen Zuwachs von 1,7% im September zu, seinen besten Monat seit Juni.
06 ROHSTOFFE — ÖL SPRINGT, GOLD STÜRZT AB
Öl: Die Ölpreise sprangen, nachdem Präsident Trump Irans Waffenstillstandsvorschlag abgelehnt hatte und damit die Hoffnungen auf eine diplomatische Lösung des Nahost-Konflikts zunichtemachte. Brent-Rohöl-Futures stiegen um 3,43 $ oder 3,29% auf 107,75 $ pro Barrel, während WTI bei 94,55 $ pro Barrel lag, ein Plus von 2,14 $ oder 2,32%.
| Öl-Benchmark | Preis | Veränderung |
|---|---|---|
| Brent-Rohöl | 107,75 $/Barrel | +3,29% |
| WTI-Rohöl | 94,55 $/Barrel | +2,32% |
Gold: Spot-Gold fiel um 1,5% auf 4.223,95 $ pro Unze, während US-Gold-Futures ebenfalls um 1,5% auf 4.257,90 $ fielen. Unter anderen Edelmetallen fiel Spot-Silber um 2,6% auf 62,64 $ pro Unze, Platin verlor 2,1% auf 1.741,45 $, während Palladium um 2,1% auf 1.239,95 $ fiel.
| Metall | Preis | Veränderung |
|---|---|---|
| Gold (Spot) | 4.223,95 $/oz | -1,50% |
| Gold-Futures (COMEX) | 4.257,90 $/oz | -1,50% |
| Silber (Spot) | 62,08 $/oz | -3,40% |
| Platin | 1.730,78 $/oz | -2,70% |
| Palladium | 1.231,46 $/oz | -2,80% |
Kupfer: Kupfer-Futures fielen am Montag auf etwa 6,6 $ pro Pfund und setzten damit ihren Rückzug von Rekordhochs fort, da schwächere Wirtschaftsdaten aus dem Hauptabnehmerland China die Nachfrageaussichten belasteten. Der 3-Monats-Benchmark der London Metal Exchange fiel auf 14.389,50 $ pro Tonne, den niedrigsten Stand seit dem 17. September.
Erdgas: Die europäischen Erdgaspreise stiegen um 3% auf über 74 €/MWh, da die anhaltenden LNG-Lieferunterbrechungen Katars und die Unsicherheit über die Straße von Hormus Bedenken hinsichtlich der Gasversorgung aufwarfen. US-Erdgas-Futures fielen um über 3% auf 3,125 $ pro MMBtu.
Landwirtschaft: Sojabohnen-Futures stürzten ab, nachdem eine Liste von Waren, die wahrscheinlich von reduzierten Zöllen betroffen sein werden, Sojabohnen nicht enthielt. Weizen erholte sich von einem Intraday-Verlust von 23,5 Cent. Mais-Futures wurden niedriger gehandelt. Rohöl verlor in der Woche fast 8% und Palmöl fiel um 4,6%.
07 KRYPTOWÄHRUNGEN — BITCOIN FÄLLT AUF IRAN-SCHOCK
Bitcoin fiel am Montag im frühen Handel um 1,22% auf 83.428 $, belastet durch höhere Rohölpreise, einen stärkeren Dollar und abkühlende ETF-Zuflüsse. Die führende Kryptowährung bewegte sich am Wochenende kurzzeitig über 85.000 $, bevor sie zurückfiel. Ethereum kämpfte darum, sich über 2.800 $ zu halten, und wurde mit einem Rückgang von 1,97% bei 2.650 $ gehandelt.
| Rang | Name | Preis | 24h-Veränderung |
|---|---|---|---|
| 1 | Bitcoin (BTC) | 83.428 $ | -1,22% |
| 2 | Ethereum (ETH) | 2.650 $ | -1,97% |
| 3 | Tether (USDT) | 0,9998 $ | stabil |
| 4 | BNB | 769,83 $ | -0,50% |
| 5 | XRP | 1,49 $ | -1,50% |
| 6 | USDC | 0,9999 $ | stabil |
| 7 | Solana (SOL) | 115,50 $ | -0,80% |
| 8 | TRON (TRX) | 0,3450 $ | -0,30% |
| 9 | Dogecoin (DOGE) | 0,0950 $ | -1,20% |
| 10 | Cardano (ADA) | 0,2400 $ | -1,80% |
| 11 | Hyperliquid (HYPE) | 93,50 $ | -0,90% |
| 12 | Chainlink (LINK) | 12,50 $ | -1,50% |
| 13 | Avalanche (AVAX) | 7,55 $ | -1,20% |
| 14 | Stellar (XLM) | 0,2150 $ | -1,00 |
Leave a Reply